 2 min
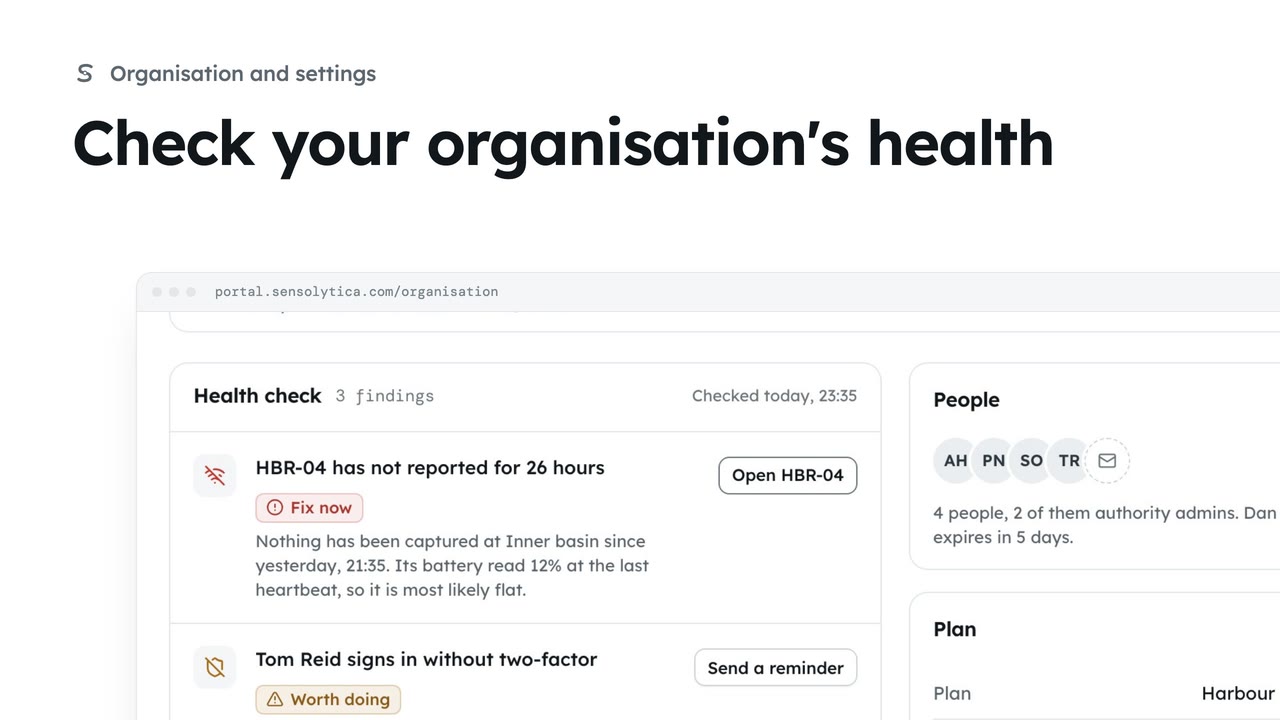
2 minCheck your organisation's health
Read the organisation overview: its figures, the health check with what to fix first, and send a two-factor reminder from it.
2 min3 stepsAdmin
See when breaches happen, by weekday and hour, how each zone keeps to its limit and what passes, and save the figures as a CSV.
Analytics
The organisation page, then Analytics. One period for the whole page.
Weekday by hour
The pattern to plan patrols around. Switch between breaches and all captures.
Compliance by zone
Each zone against its limit, and what was seen, by class.
CSV, or a report
CSV saves the figures. Build a report makes a sealed report from them.
On the organisation page, choose the Analytics tab. One period, here 30 days, applies to the whole page, compared with the 30 days before.
When it happens shows every zone by weekday and hour. It is the pattern to plan patrols around. Switch between breaches and all captures.
Compliance by zone shows how each zone keeps to its limit; choose one to open it. What was seen, by class, splits the passes into launches, yachts, jet skis and the rest.
CSV, at the top, saves the figures for a spreadsheet. For the committee, Build a report makes a report from sealed records instead.
Sign in with your work email. Your own organisation's records, nodes and units take the place of the Westmouth ones.
2 minRead the organisation overview: its figures, the health check with what to fix first, and send a two-factor reminder from it.
2 min3 stepsAdmin
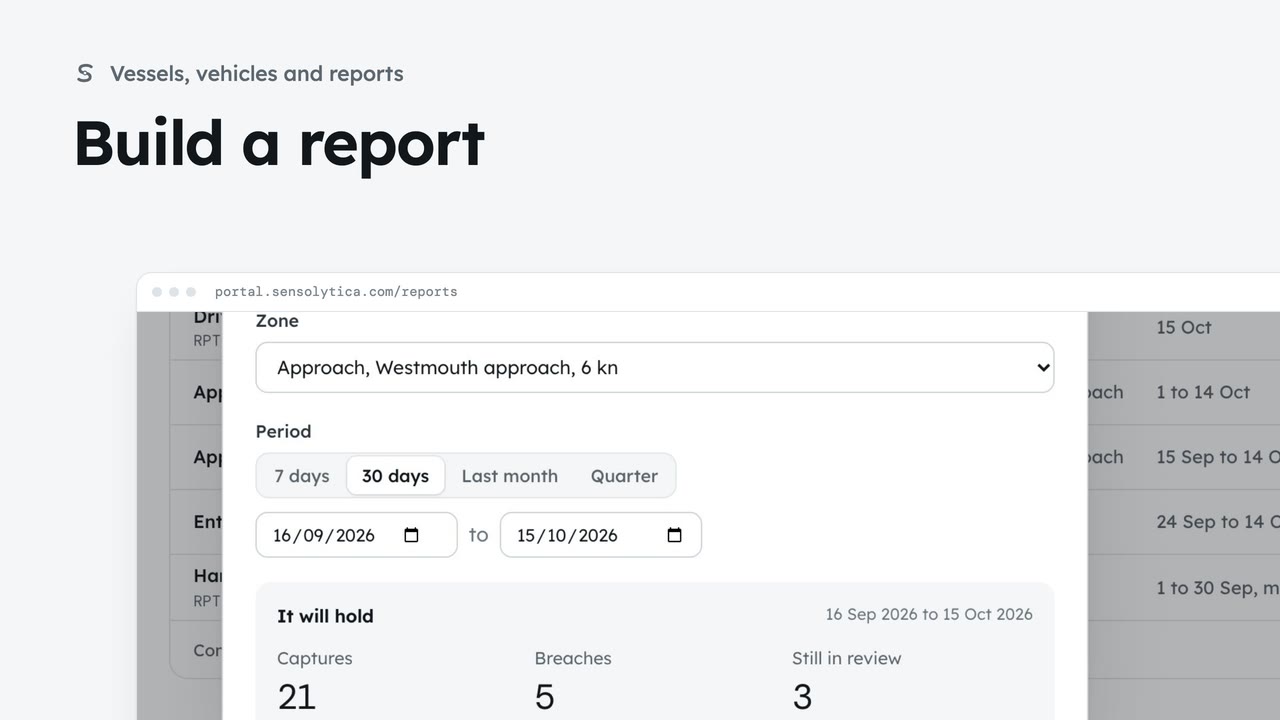 2 min
2 minChoose a kind, a zone and a period, see what the report will hold, then make it from sealed records.
2 min5 stepsAdmin, Operator
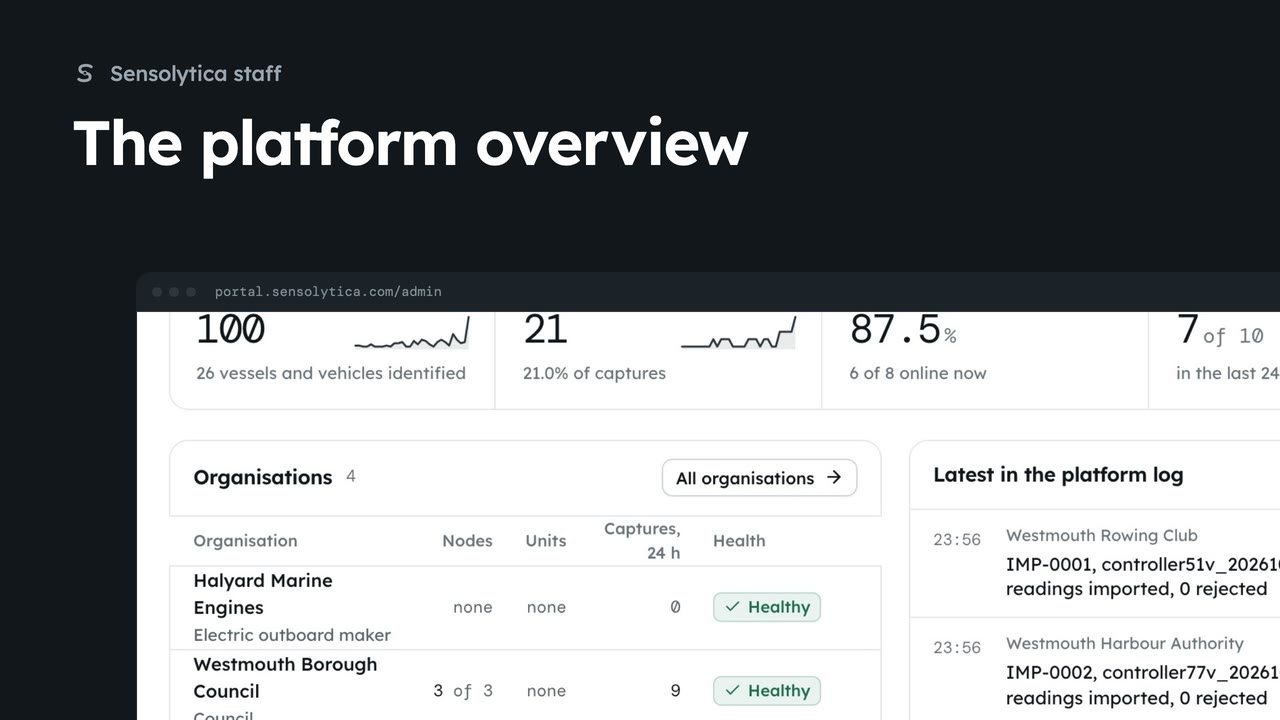 2 min
2 minSee what needs Sensolytica staff across every organisation, how the platform did over 30 days, and where to go next.
2 min6 stepsSensolytica staff
Checked against the portal on 15 October 2026. Westmouth names, vessels, units and figures are illustrative. General guidance on using the portal, not legal, regulatory or financial advice.