 2 min
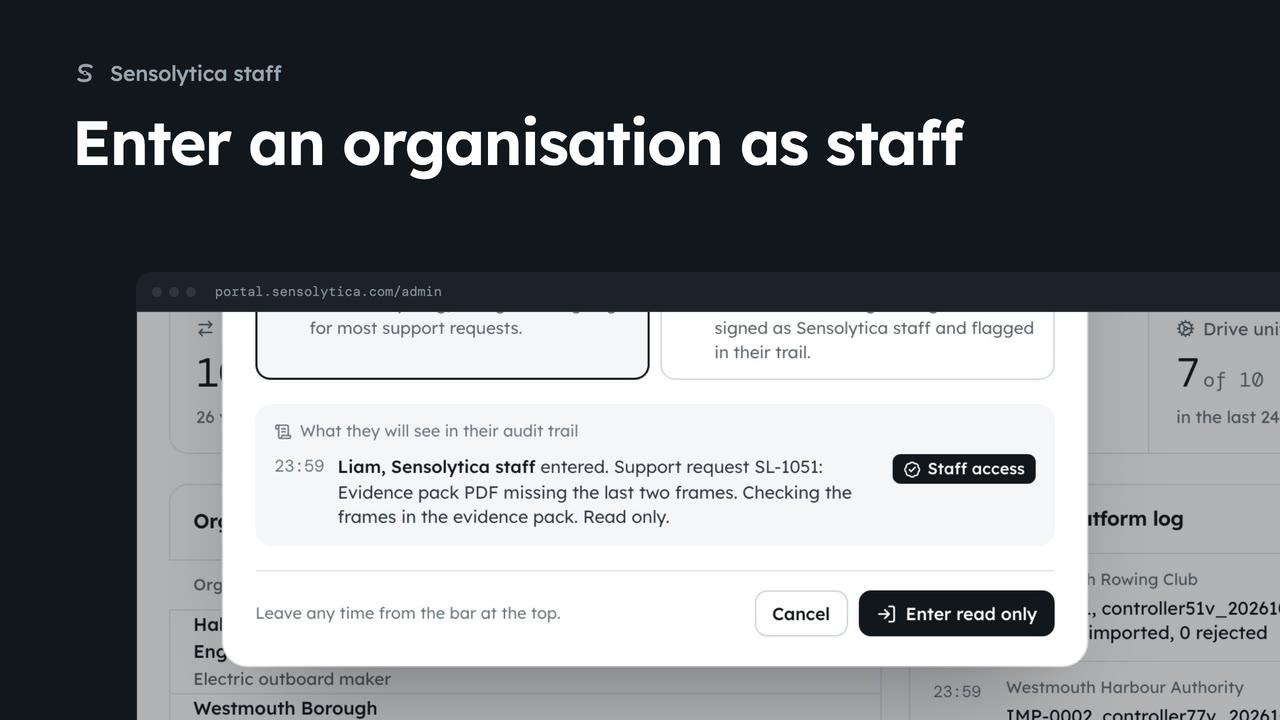
2 minEnter an organisation as staff
Act inside an organisation as Sensolytica staff with a recorded reason, then leave it again.
2 min7 stepsSensolytica staff
See what needs Sensolytica staff across every organisation, how the platform did over 30 days, and where to go next.
Platform overview
Overview under Platform in the sidebar opens the whole platform. The tabs under the title lead to every staff page.
Needs staff
Urgent support, shore nodes down, drive units silent over 48 hours and failed installs. Each card links to where you deal with it.
Four figures, 30 days
Captures, breaches, shore node uptime and drive units reporting, across every organisation.
Every tenant at a glance
Organisations lists nodes, units, open reviews and health. Latest in the platform log sits beside it.
Platform analytics
The Analytics tab charts captures and breaches by day. Switch between 7 days and 30 days at the top right.
Who captures what
By organisation ranks tenants by captures. Uptime shows each shore node and drive units reporting.
As Sensolytica staff, Overview under Platform in the sidebar opens the platform overview. It covers every organisation at once, and the tabs under the title lead to organisations, the central record, users, firmware, the platform log, support and the agent.
Needs staff comes first. It counts urgent support requests, shore nodes that have stopped reporting, drive units silent for more than 48 hours, and failed firmware installs. Here HBR-04 is down, and its card links straight to the page that deals with it.
The four figures show the platform over the last 30 days: captures, breaches as a share of captures, shore node uptime with how many are online now, and how many drive units reported in the last day.
Below, each organisation has a row with its nodes, drive units, open reviews and health. Its name opens its platform page. Beside it, Latest in the platform log shows the newest warnings and events from every organisation.
For more depth, click the Analytics tab. It charts captures and breaches by day across every organisation. Choose 7 days for the recent picture, or 30 days for the trend.
By organisation ranks each tenant by captures and breaches, and links to its page. Uptime shows every shore node over 30 days, names the lowest, and how many drive units each fleet has reporting.
Sign in with your work email. Your own organisation's records, nodes and units take the place of the Westmouth ones.
2 minAct inside an organisation as Sensolytica staff with a recorded reason, then leave it again.
2 min7 stepsSensolytica staff
 2 min
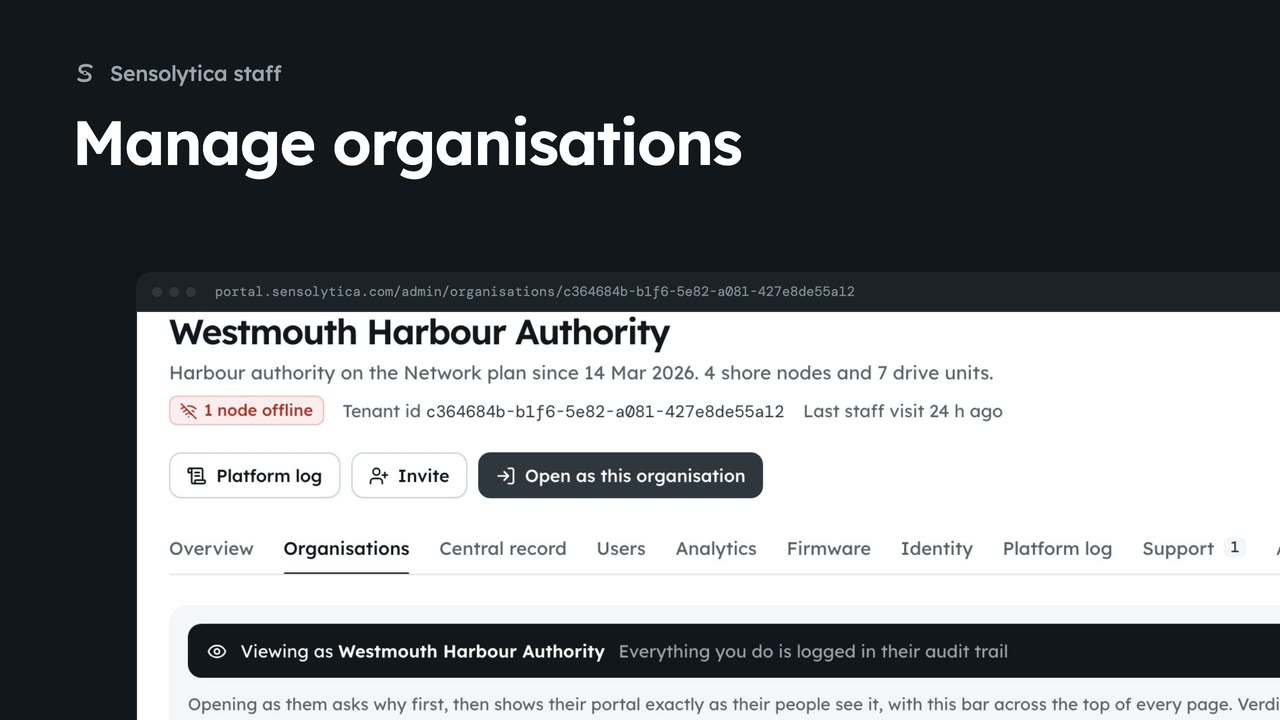
2 minFind an organisation, check its health and fleet on its platform page, and create a new one.
2 min6 stepsSensolytica staff
 1 min
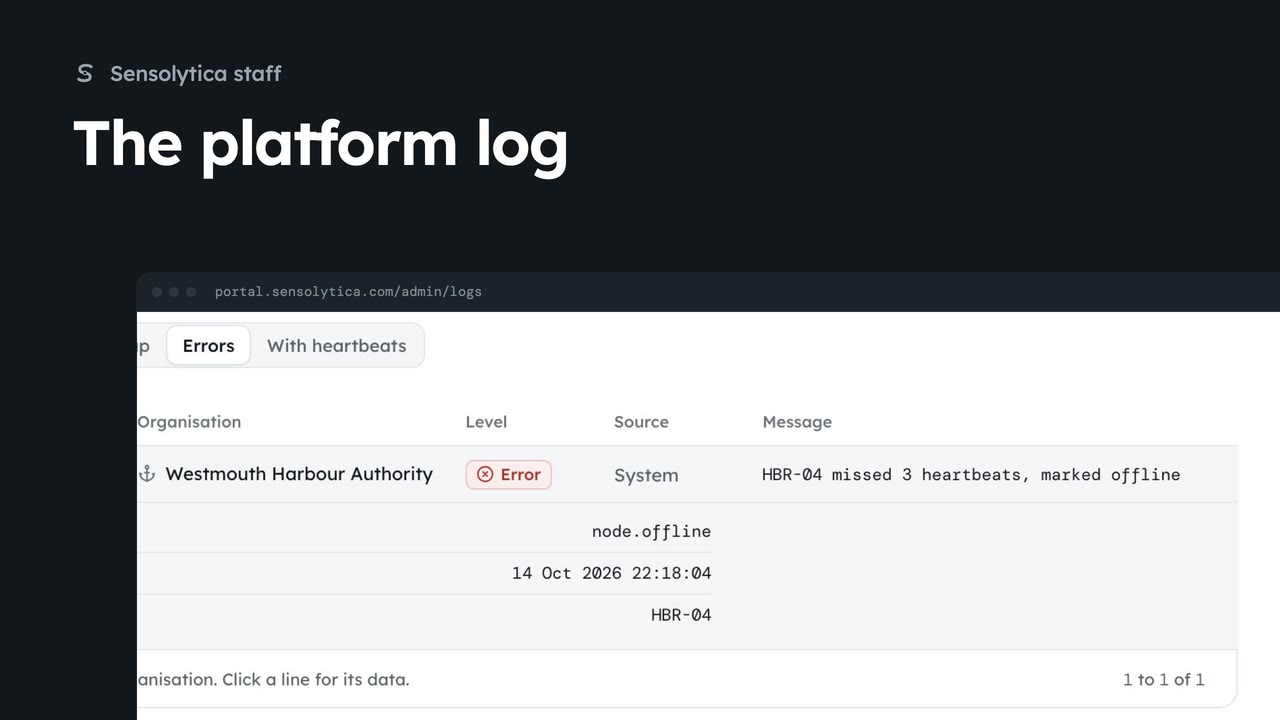
1 minSearch everything the platform and the fleet did across every organisation in the platform log, and export what you find.
1 min4 stepsSensolytica staff
Checked against the portal on 15 October 2026. Westmouth names, vessels, units and figures are illustrative. General guidance on using the portal, not legal, regulatory or financial advice.